


The report view displays the selected dataset information and presents the report data using the configured chart type.
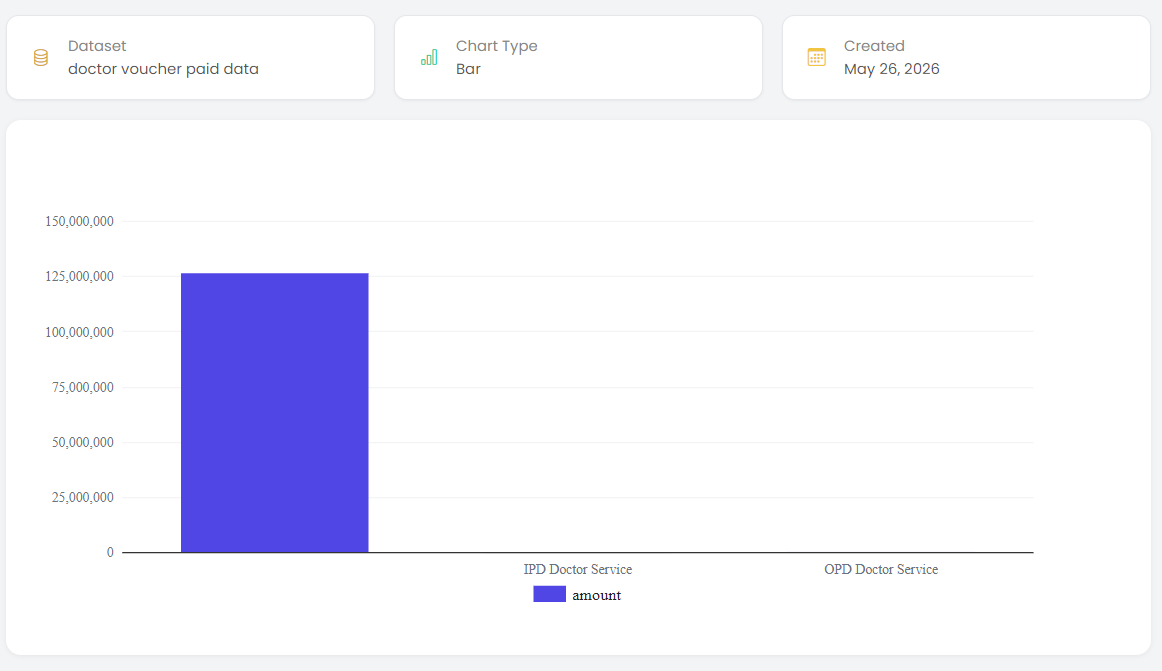
The report view includes:
- Dataset – Displays the dataset used for the report.
- Chart Type – Displays the chart type used for the report.
- Created – Displays the date on which the report was created.
The chart displays the report data based on the configured fields. In the displayed bar chart, the TYPE values are shown on the horizontal axis and the amount value is displayed as the metric.
The chart includes a legend identifying the displayed metric.