

 SKYNYX BI
- Features
- 100% Free Forever
- User Guide
- How To Videos
Turn Business Data Into Powerful Visual Insights
Build custom dashboards, connect multiple data sources, and generate meaningful reports with Skynyx BI — your complete self-service analytics platform.
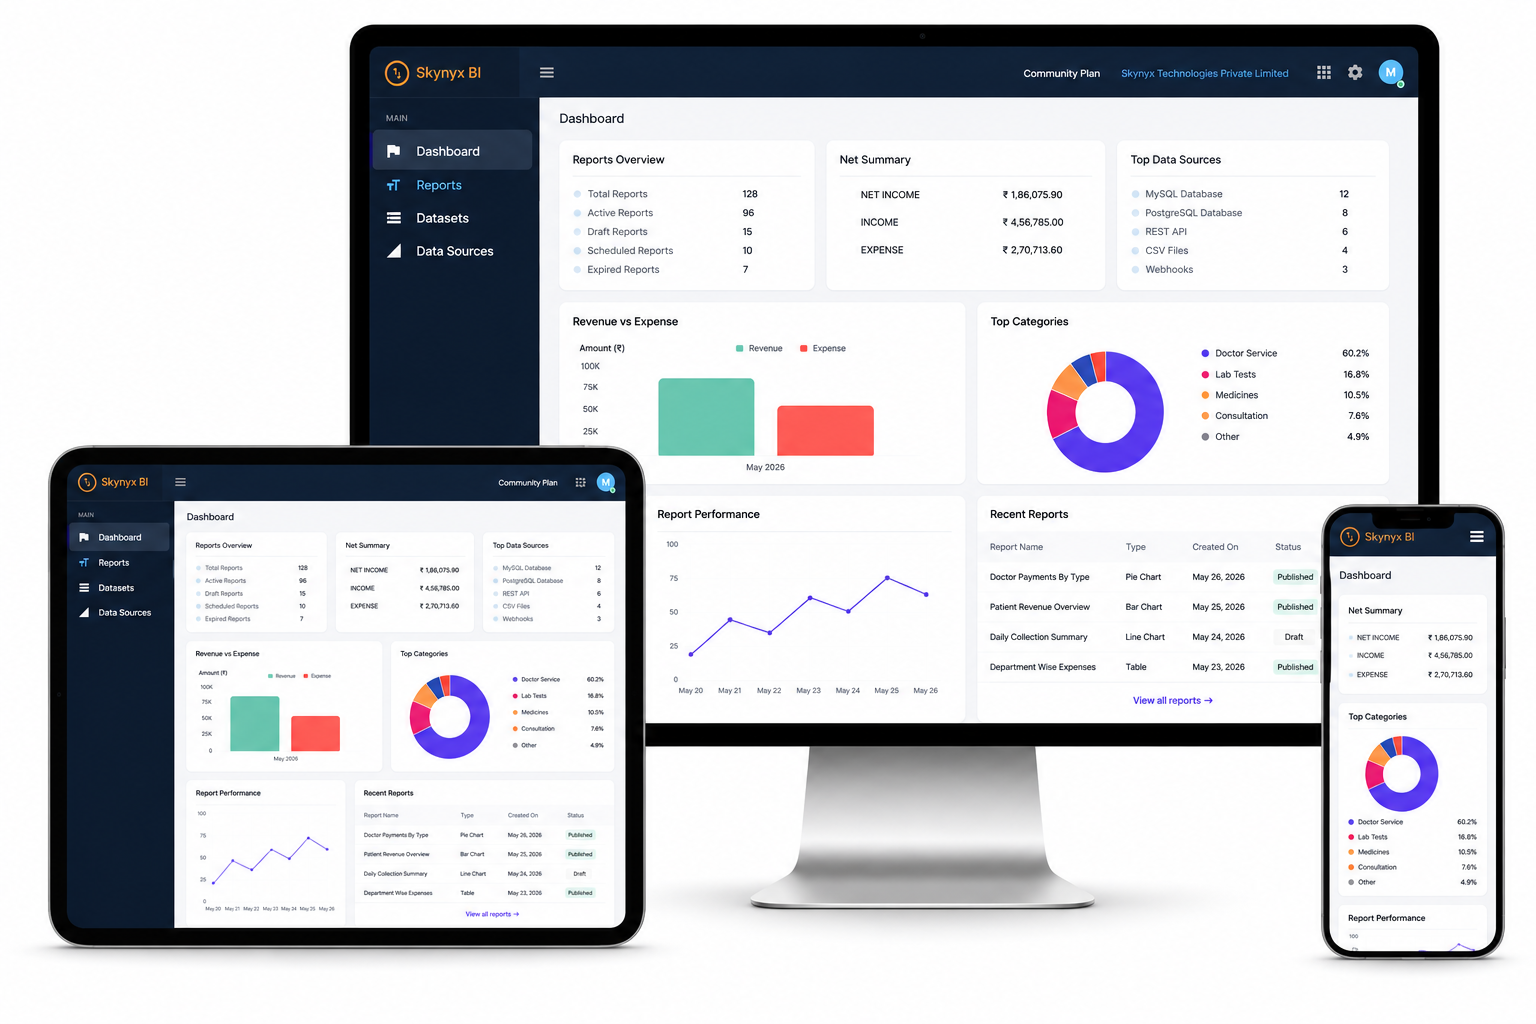
Flexible Analytics for Every Business
Skynyx BI helps teams transform raw data into structured datasets, custom reports, and visual dashboards without complex development.
From data connection to final chart visualization, everything is streamlined in one platform.
Features at a Glance
Custom Dashboard Builder
Create personalized dashboards with multiple widgets and organize reports based on your business needs.
Multi-Source Data Integration
Connect your business data from MySQL Databases, REST APIs, Incoming Webhooks, and CSV Uploads. Bring all your data into one analytics platform.
Smart Dataset Builder
Build reusable datasets with custom tables, joins, filters, grouping, sorting, and aggregations. Perfect for advanced reporting requirements.
Live SQL Query Preview
Generate and preview SQL queries in real time before saving datasets. Reduce errors and validate data instantly.
Multiple Chart Types
Visualize your data using Bar Charts, Pie Charts, Line Charts, Area Charts, Data Tables, KPI Metrics, and Geo Maps. Choose the best format for your business analysis.
Drag & Drop Report Builder
Easily map fields into chart configurations for instant visual report generation. No coding required.
Dataset Management
Store, edit, preview, and manage structured datasets for repeated reporting workflows.
Interactive Reports
View reports with detailed metadata including dataset source, chart type, and creation history.
Build Smarter Reports with Skynyx BI
From data collection to dashboard visualization, Skynyx BI gives your business complete control over analytics.
Create Your First Dashboard →