


The Dashboard provides a visual overview of business data in Skynyx BI. It displays information through multiple charts and graphical components, allowing users to view and analyze business information in an organized format.
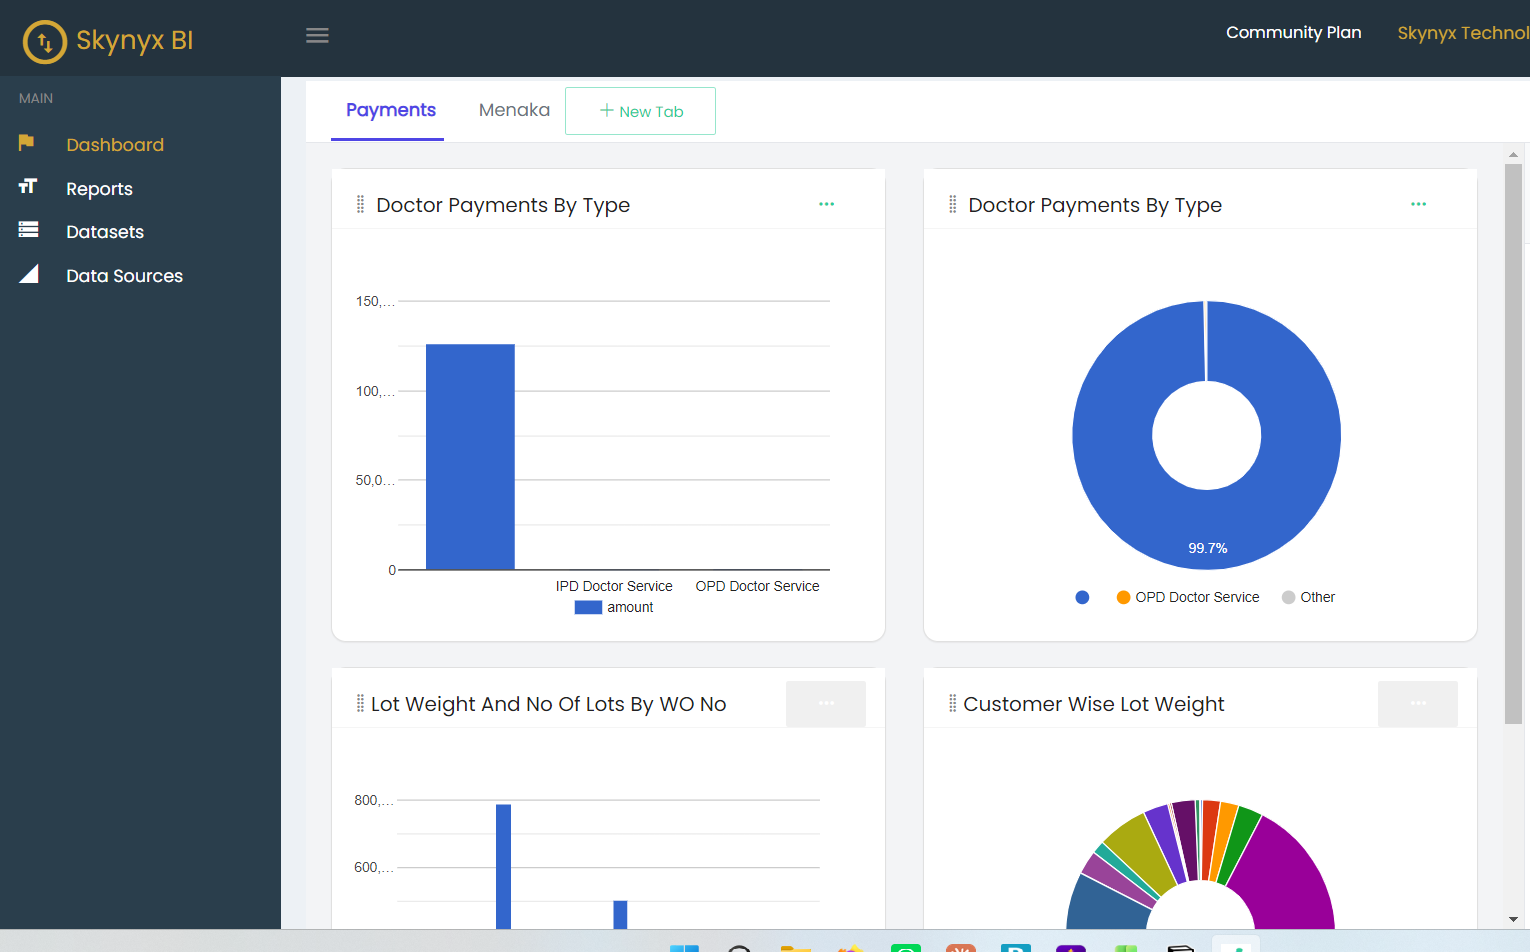
The Dashboard includes the following main options:
- Dashboard – Displays the available dashboard views and visualizations.
- Reports – Provides access to available reports.
- Datasets – Provides access to datasets used for analysis.
- Data Sources – Provides access to configured data sources.
The dashboard area displays different visualizations such as bar charts and doughnut charts. Each visualization presents specific business information based on the configured data.
Dashboard tabs are available at the top of the screen, allowing users to switch between available dashboard views. The + New Tab option allows a new dashboard tab to be added.
Each dashboard visualization includes an options menu for managing the respective chart. The dashboard can also be scrolled to view additional visualizations available on the page.