


The Report Settings section allows users to define the basic details of a report.
- Report Name – Enter the name of the report.
- Data Source (Dataset) – Select the dataset to be used for the report.
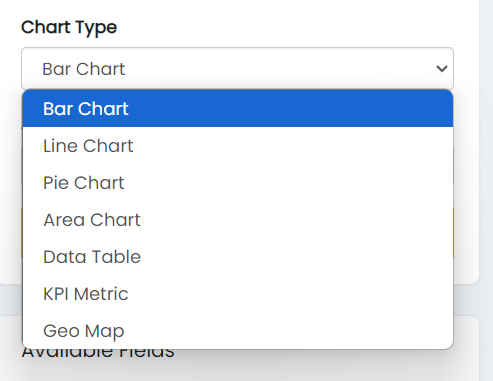
- Chart Type – Select the required visualization type.
The available Chart Type options are:
- Bar Chart
- Line Chart
- Pie Chart
- Area Chart
- Data Table
- KPI Metric
- Geo Map
- Add to Dashboard (Optional) – Select a dashboard for adding the report. The available option shown is None.
Click Save Report to save the report configuration.