


The Create New Report page allows users to create a report using a dataset and configure its chart visualization.
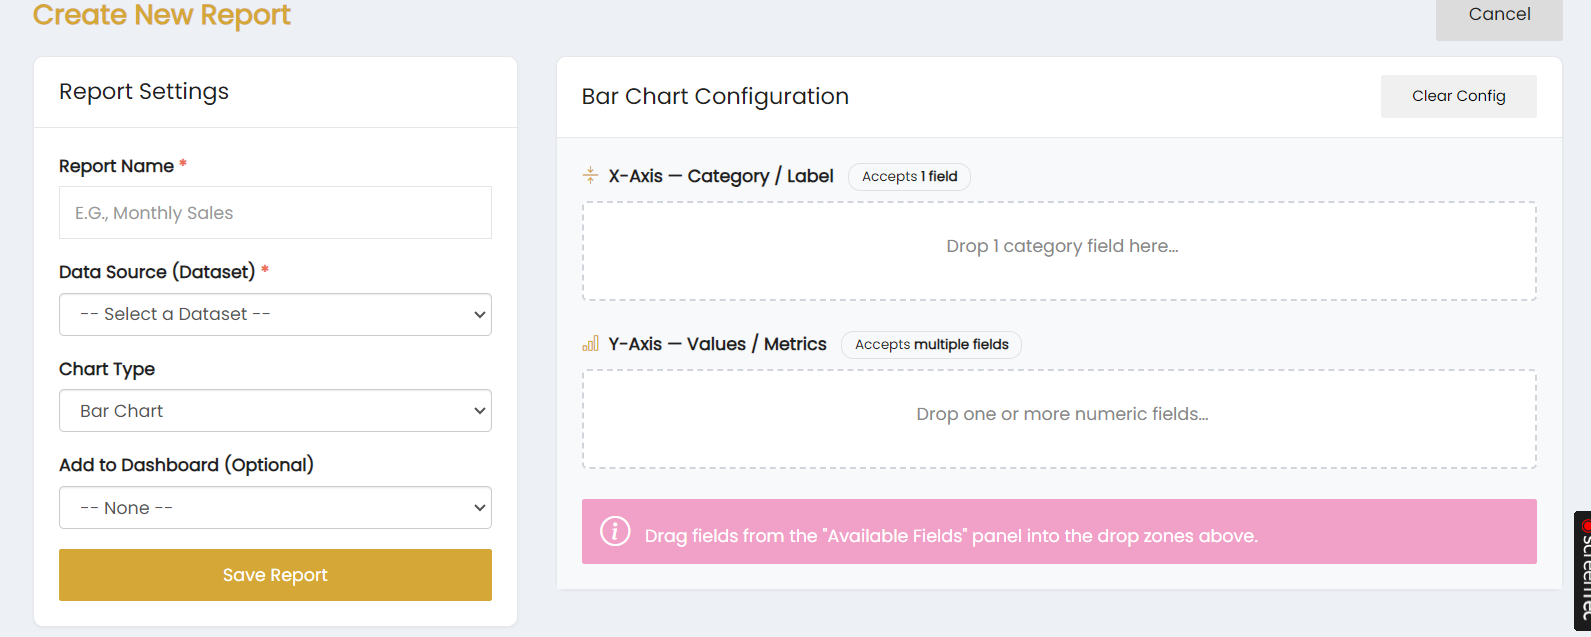
Report Settings
- Report Name – Enter the name of the report.
- Data Source (Dataset) – Select the dataset to be used for the report.
- Chart Type – Select the required chart type. The chart type shown is Bar Chart.
- Add to Dashboard (Optional) – Select a dashboard to add the report to. The default option shown is None.
Bar Chart Configuration
For a Bar Chart, configure the following fields:
- X-Axis – Category / Label – Select a category or label field. This section accepts one field.
- Y-Axis – Values / Metrics – Select one or more numeric fields for the chart.
Fields can be dragged from the Available Fields panel into the corresponding drop zones.
The Clear Config option clears the current chart configuration.
Save Report
Click Save Report to save the configured report.
Click Cancel to exit the report creation page without saving.