


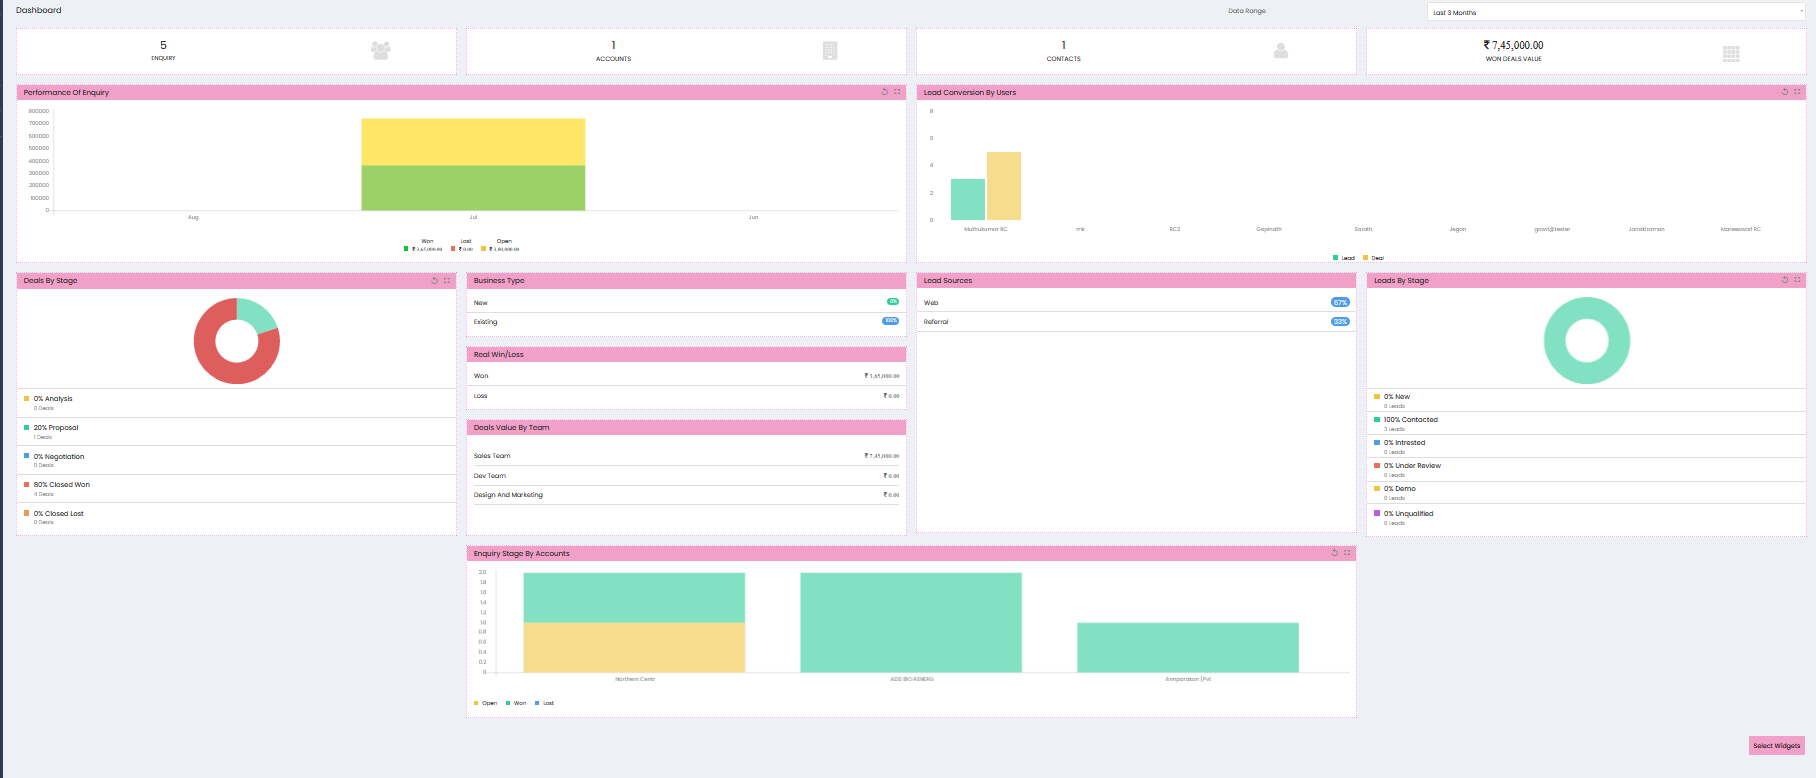
The Dashboard provides a consolidated view of key sales information and performance for the selected date range. It presents summary figures, charts, and analytical widgets to help users monitor enquiries, leads, deals, accounts, and sales value.
Date Range
The Date Range option is available at the top-right of the dashboard.
Select the required period to view dashboard information for that period.
Summary Indicators
The dashboard displays key summary information at the top:
- Enquiry – Displays the number of enquiries.
- Accounts – Displays the number of accounts.
- Contacts – Displays the number of contacts.
- Won Deals Value – Displays the value of won deals.
Performance of Enquiry
The Performance of Enquiry widget presents enquiry performance in a chart.
The chart provides information based on:
- Won
- Lost
- Open
Lead Conversion By Users
The Lead Conversion By Users widget displays lead and deal information by user.
It provides a graphical view of user-wise lead conversion activity.
Deals By Stage
The Deals By Stage widget displays the distribution of deals across different stages.
The stages shown include:
- Analysis
- Proposal
- Negotiation
- Closed Won
- Closed Lost
The widget displays the percentage and number of deals associated with each stage.
Business Type
The Business Type widget displays information based on business type.
The available classifications shown are:
- New
- Existing
Real Win/Loss
The Real Win/Loss widget displays the values for:
- Won
- Loss
This provides a view of the actual win and loss values for the selected dashboard period.
Deals Value By Team
The Deals Value By Team widget displays deal values based on the sales team.
The dashboard shows the value associated with each team listed.
Lead Sources
The Lead Sources widget displays the sources from which leads are generated.
The dashboard can display lead sources such as:
- Web
- Referral
Leads By Stage
The Leads By Stage widget displays the distribution of leads across different stages.
The stages shown include:
- New
- Contacted
- Interested
- Under Review
- Demo
- Unqualified
The widget displays the percentage and number of leads for each stage.
Enquiry Stage By Accounts
The Enquiry Stage By Accounts widget provides a graphical view of enquiry stages for the accounts displayed on the dashboard.
The chart represents enquiry activity by stages such as:
- Open
- Won
- Lost
Dashboard Widgets
The dashboard presents information through different widget formats, including:
- Summary indicators
- Bar charts
- Doughnut charts
- Stage-wise information
- List-based information
Each widget provides a focused view of a specific area of sales activity.
Dashboard Information
The dashboard brings together information related to:
- Enquiries
- Leads
- Accounts
- Contacts
- Deals
- Deal stages
- Lead sources
- Business types
- Win/Loss values
- Team-wise deal values
- Account-wise enquiry stages
The displayed information is based on the selected Date Range.